UI DESIGN · DASHBOARDS · WEB
Syntiro: making energy data readable
The story
Data people can act on
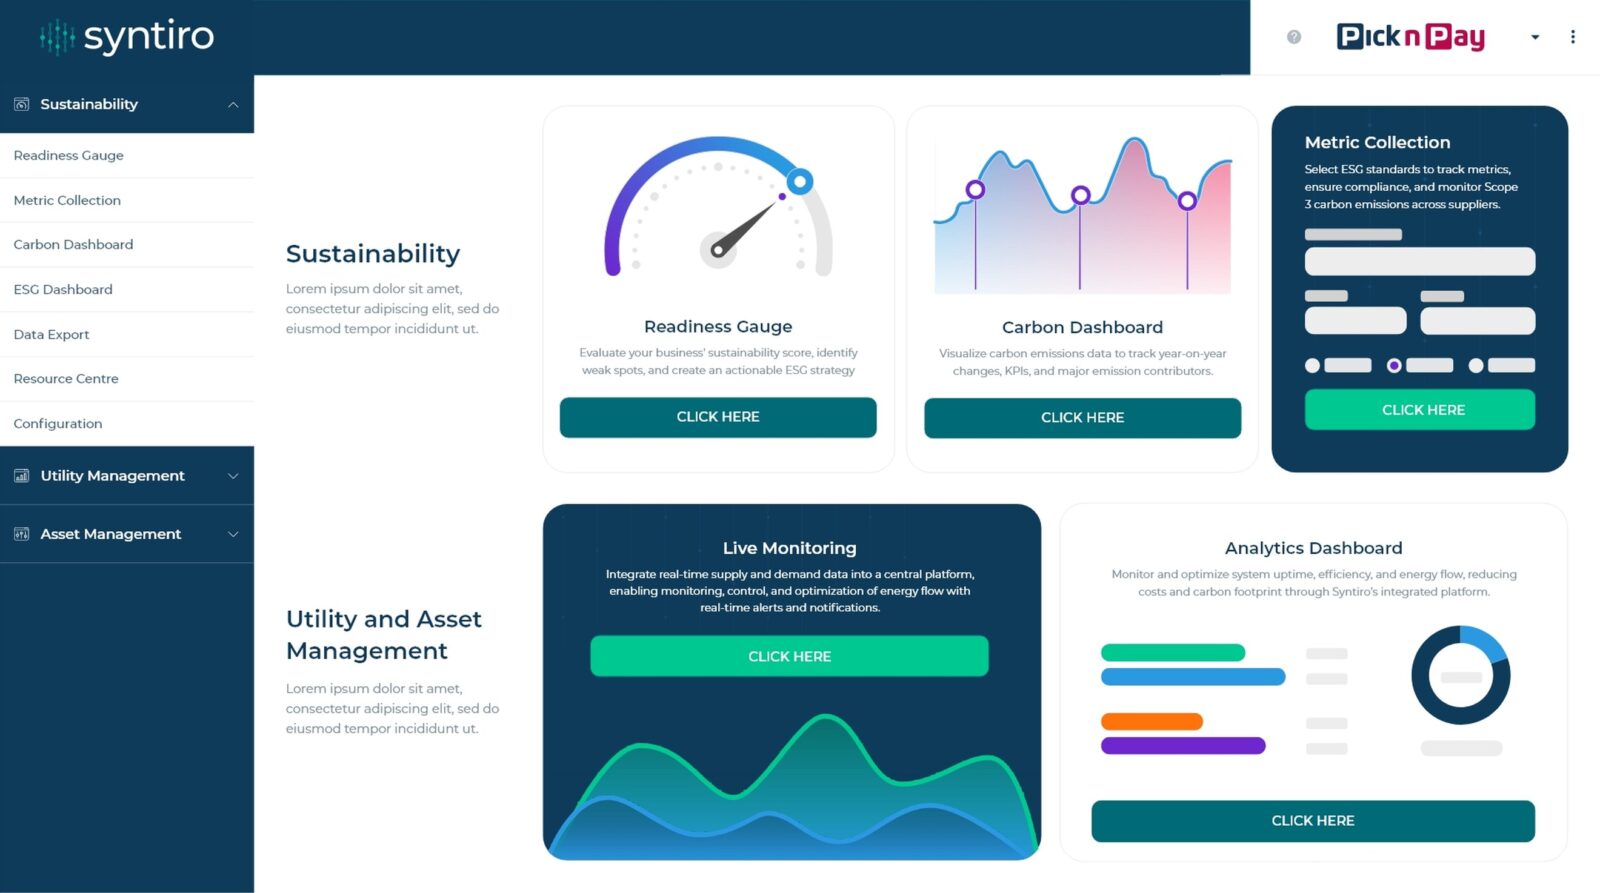
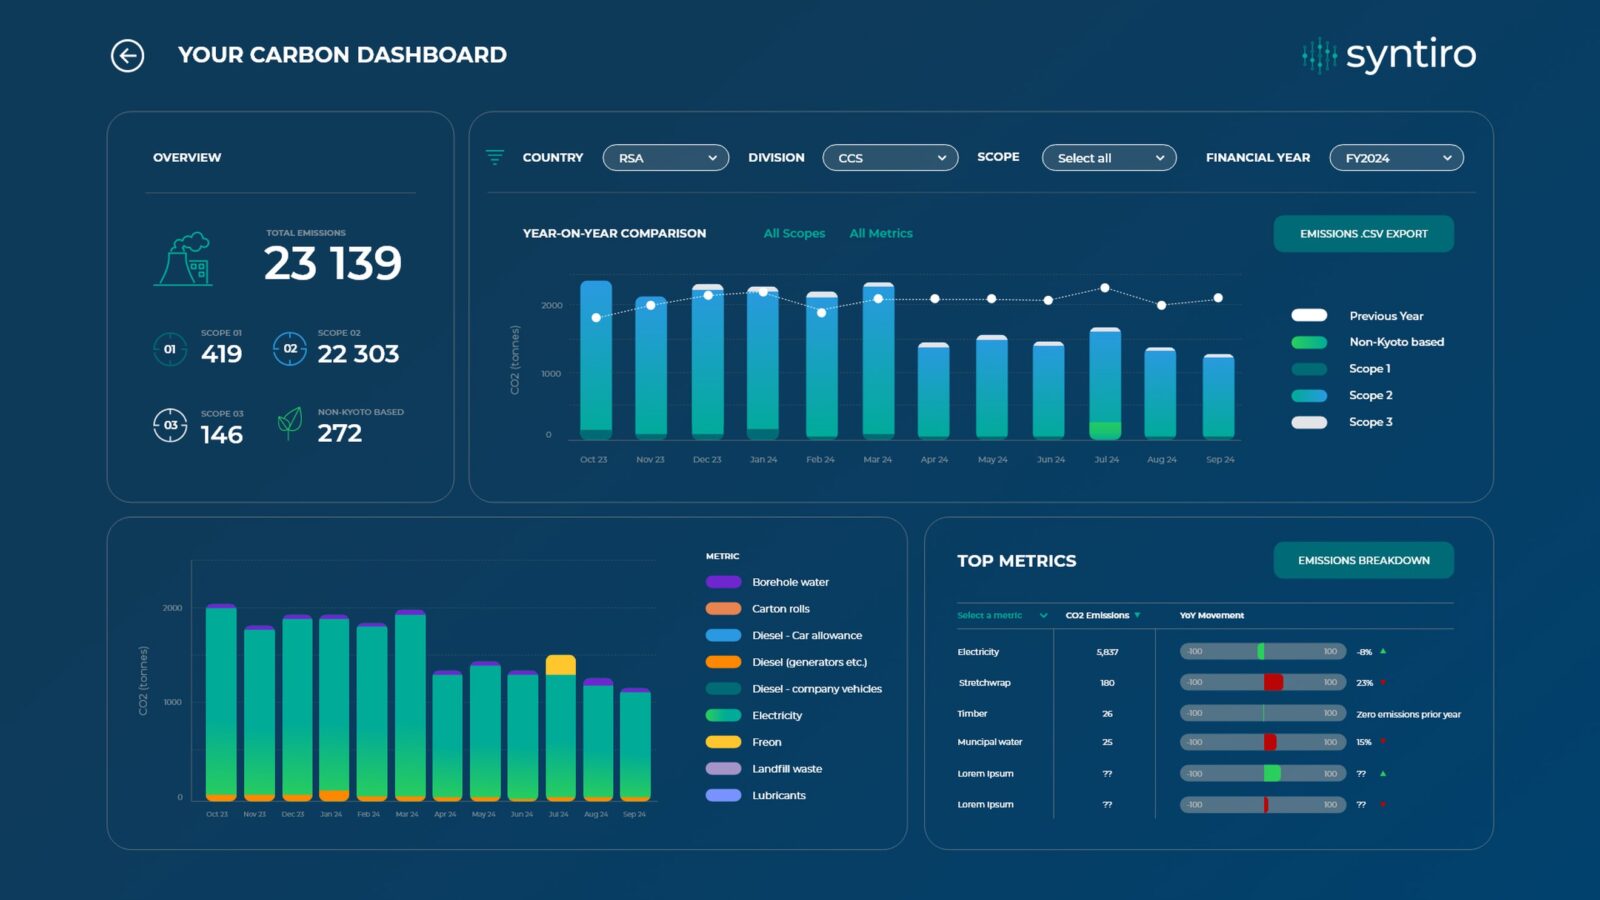
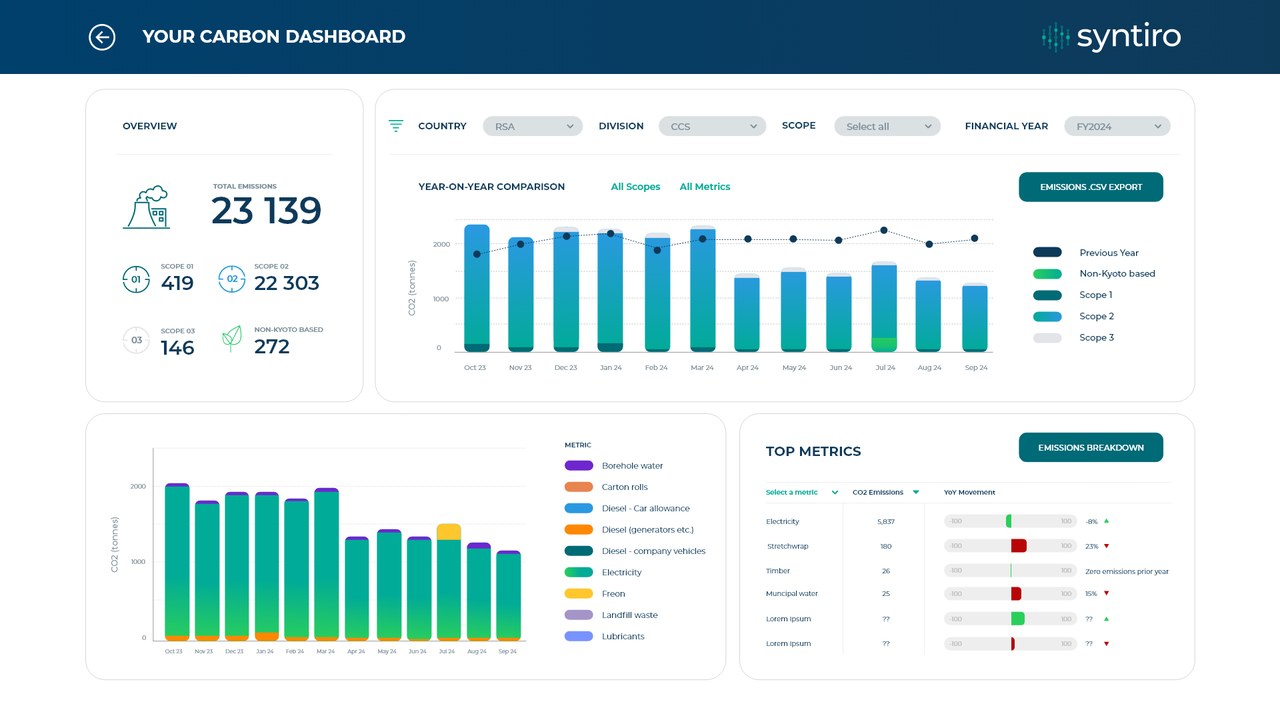
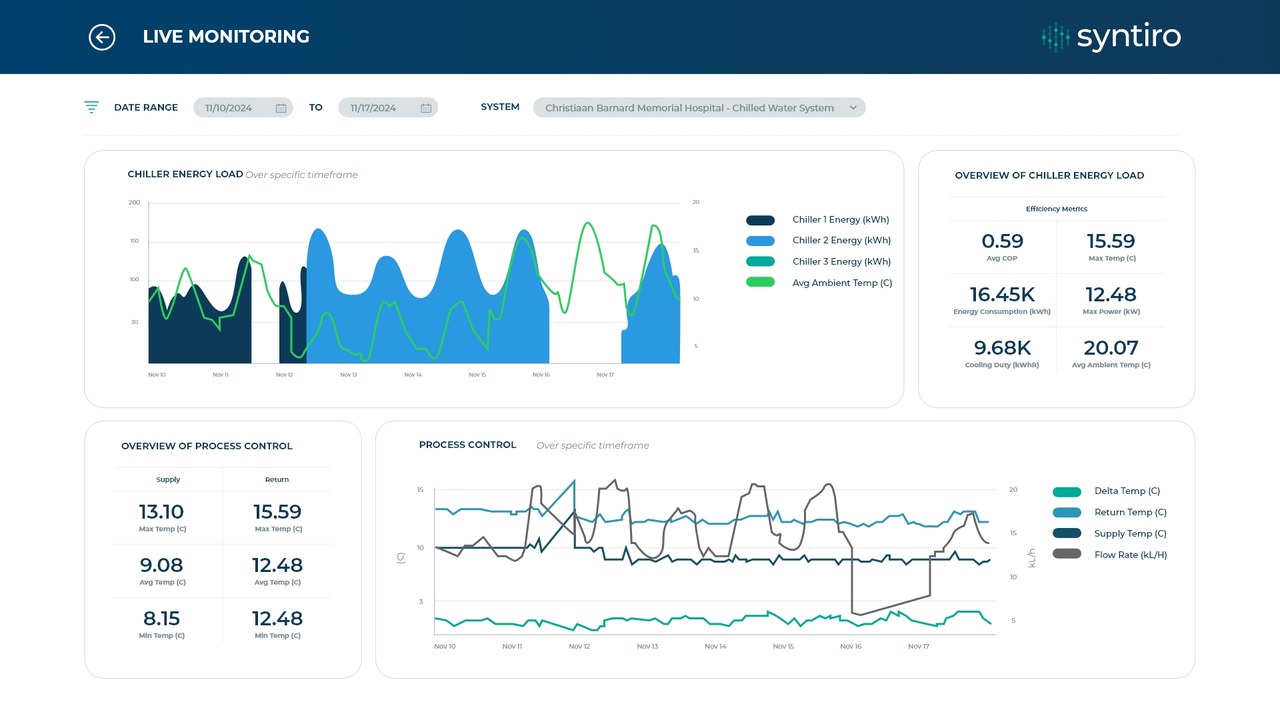
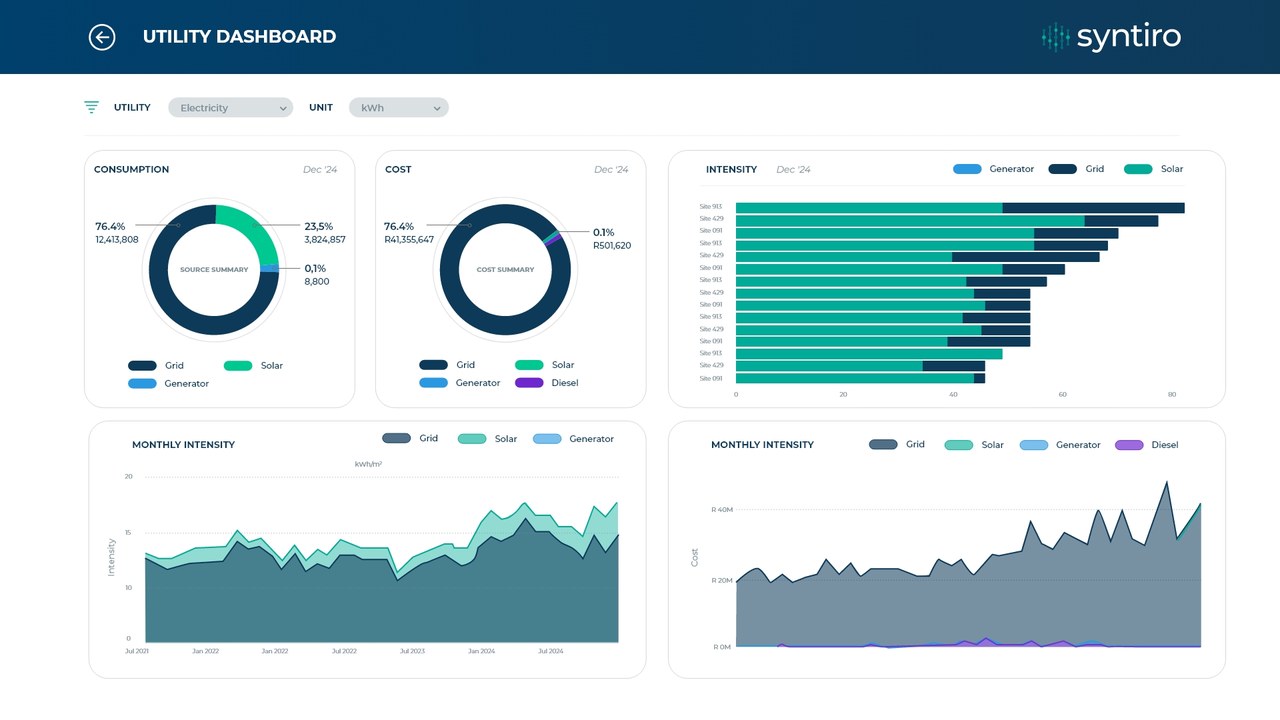
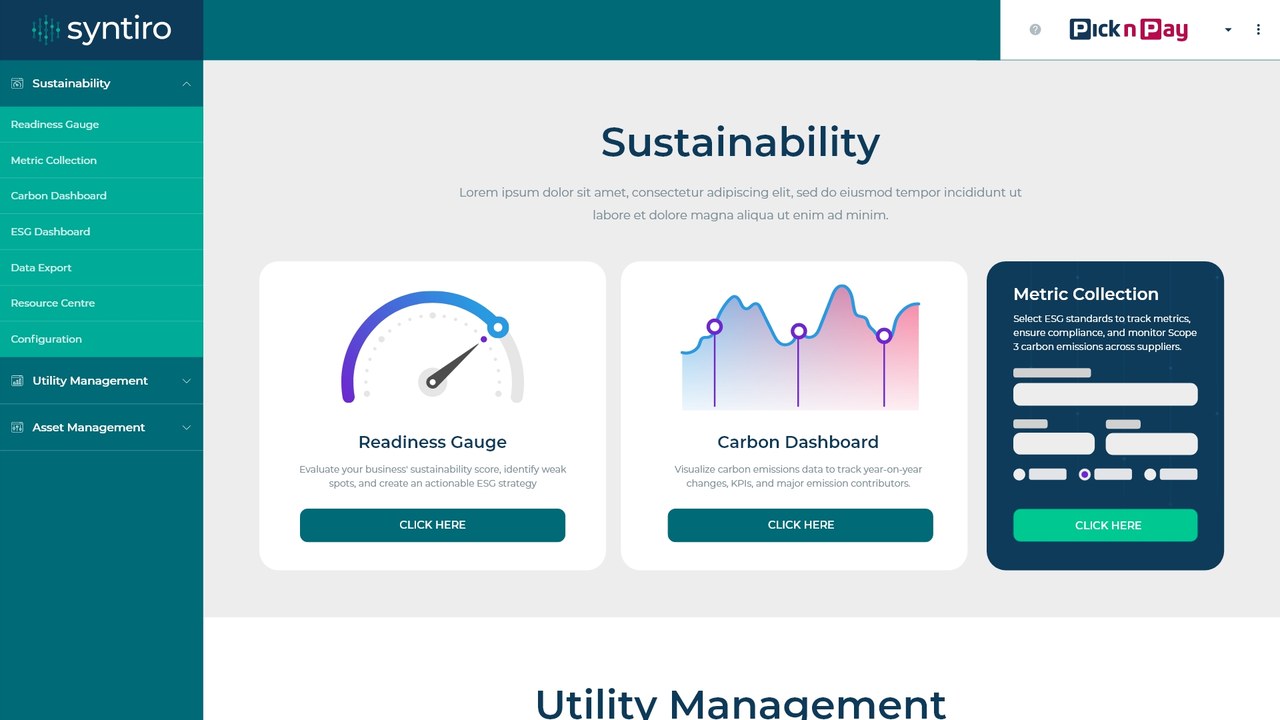
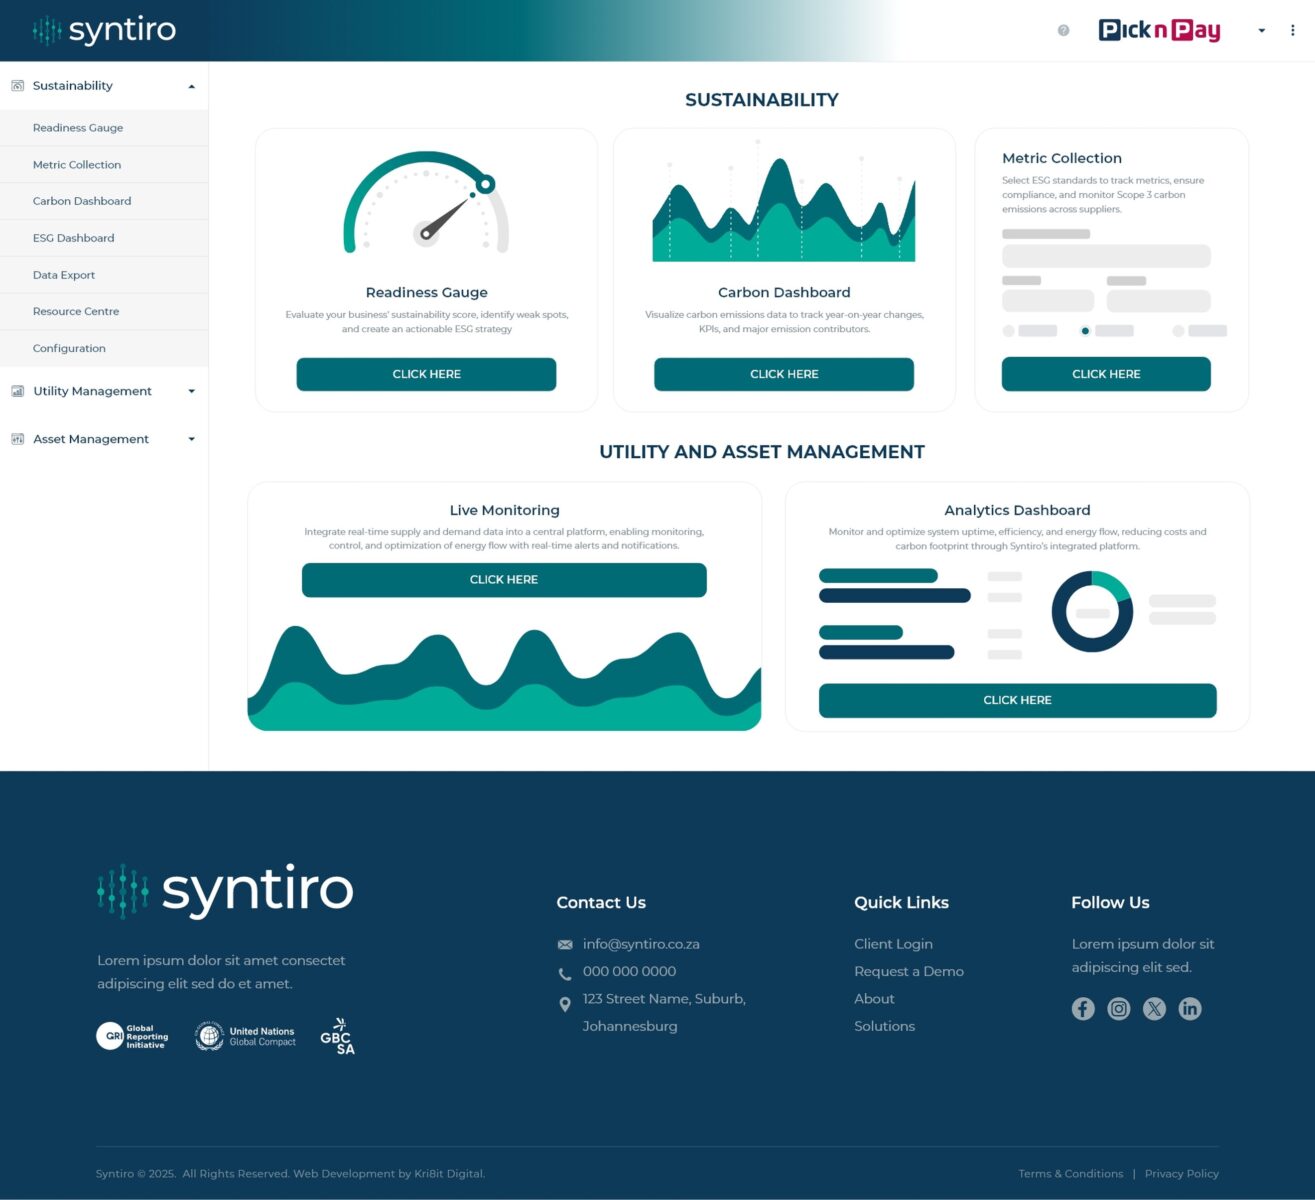
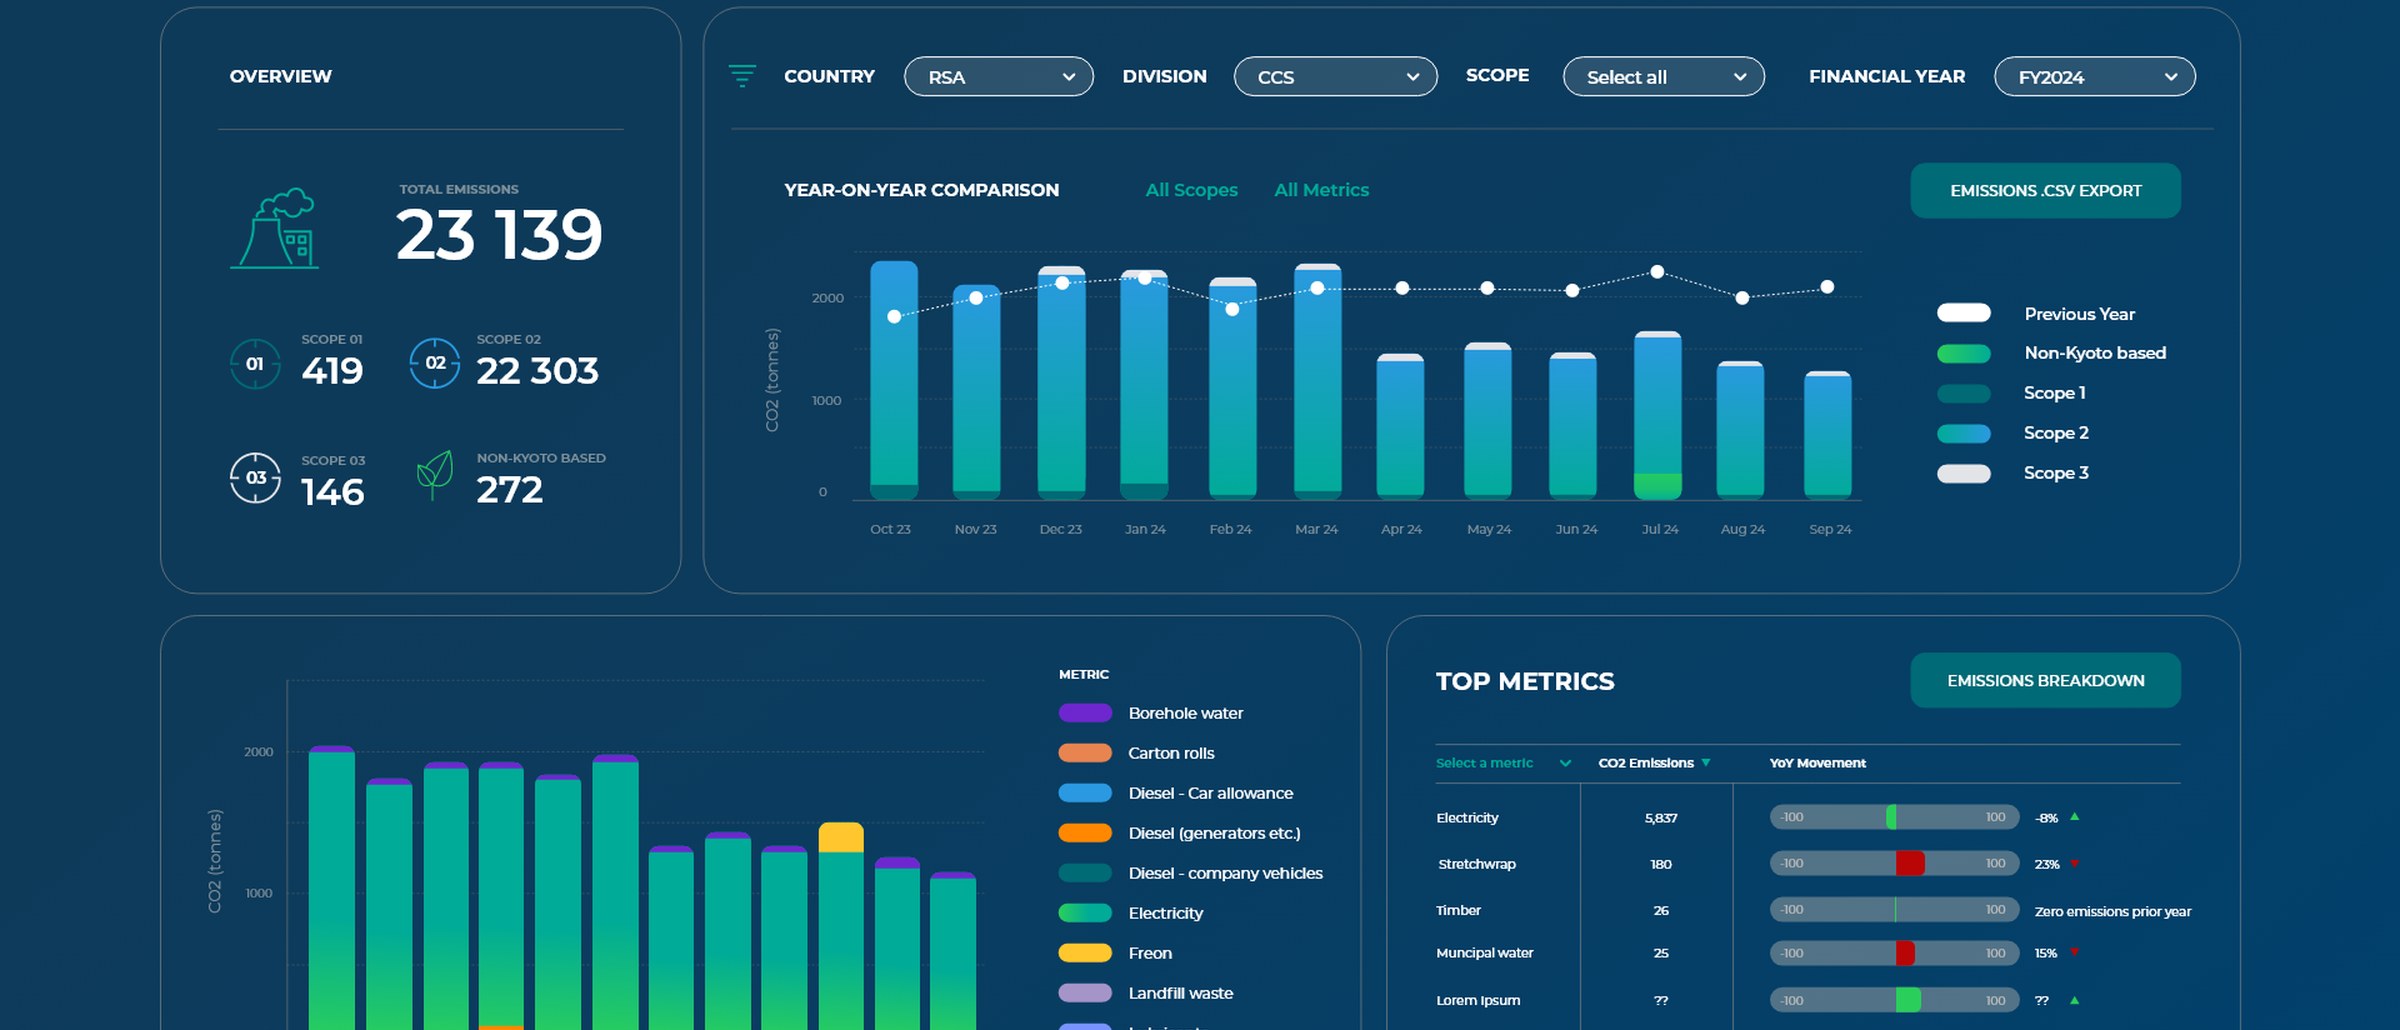
Syntiro helps businesses track sustainability, utilities and assets. I designed the dashboard landing page and a set of Power BI dashboard designs for carbon, live monitoring and utility data.
Light and dark modes and a consistent chart system mean dense numbers read clearly at a glance.
Delivered
- 01Dashboard landing page
- 02Carbon, utility & live monitoring dashboards
- 03Light & dark modes
- 04Data visualisation system
UI and dashboard design for Syntiro, with the team at Kri8it Digital, 2025. Design and layout by me.